Why the Now Visualisation is whipping up a storm, a bubbly one
The Now visualisation was the very first one designed by the then newly formed Insights team and was warmly welcomed and rapidly employed by many Empathy customers.
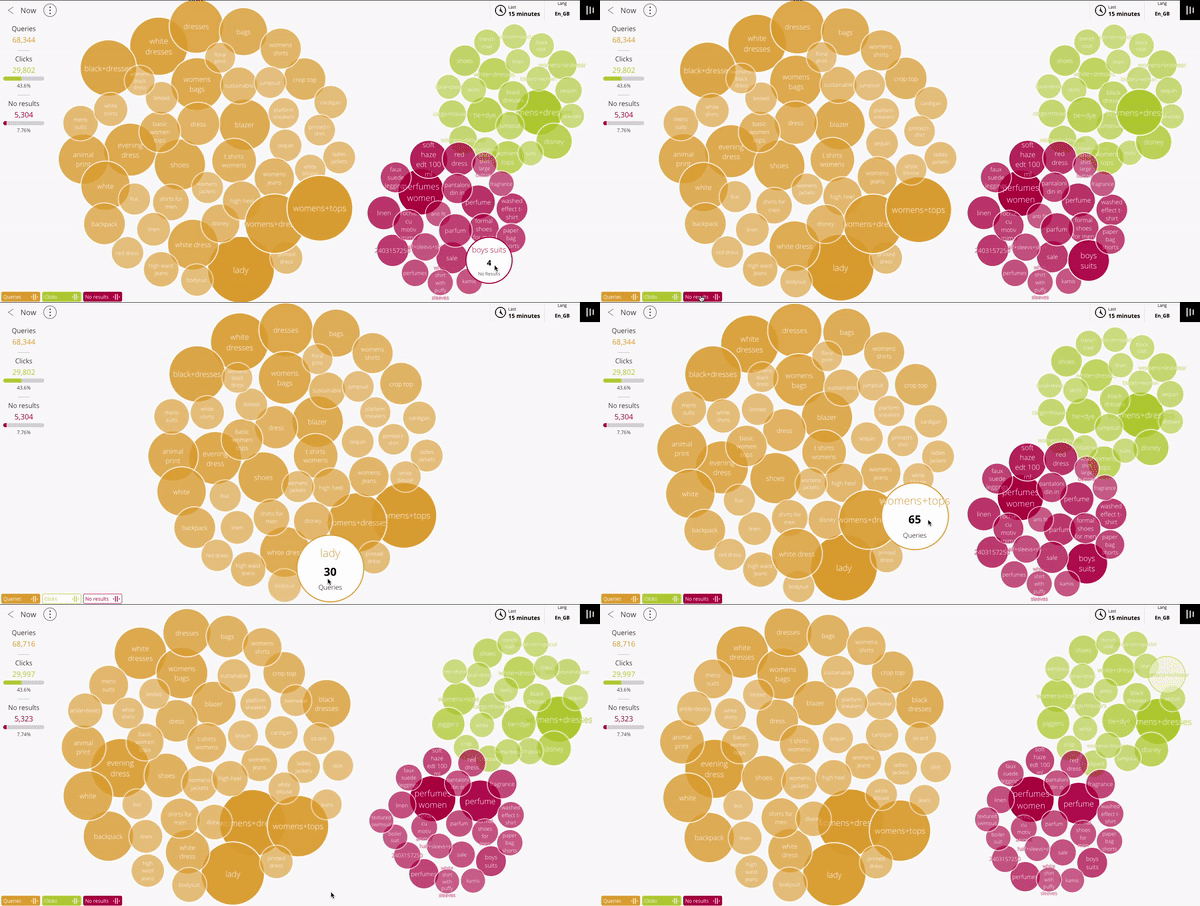
The simplicity, meaningfulness and instantaneity of presenting real-time searches in little bubbles to spot trends and create a clear picture of what’s happening at that very moment in the online store is not only incredibly useful but mesmerising and fascinating. No surprise then that it’s become one of the most demanded visualisations.
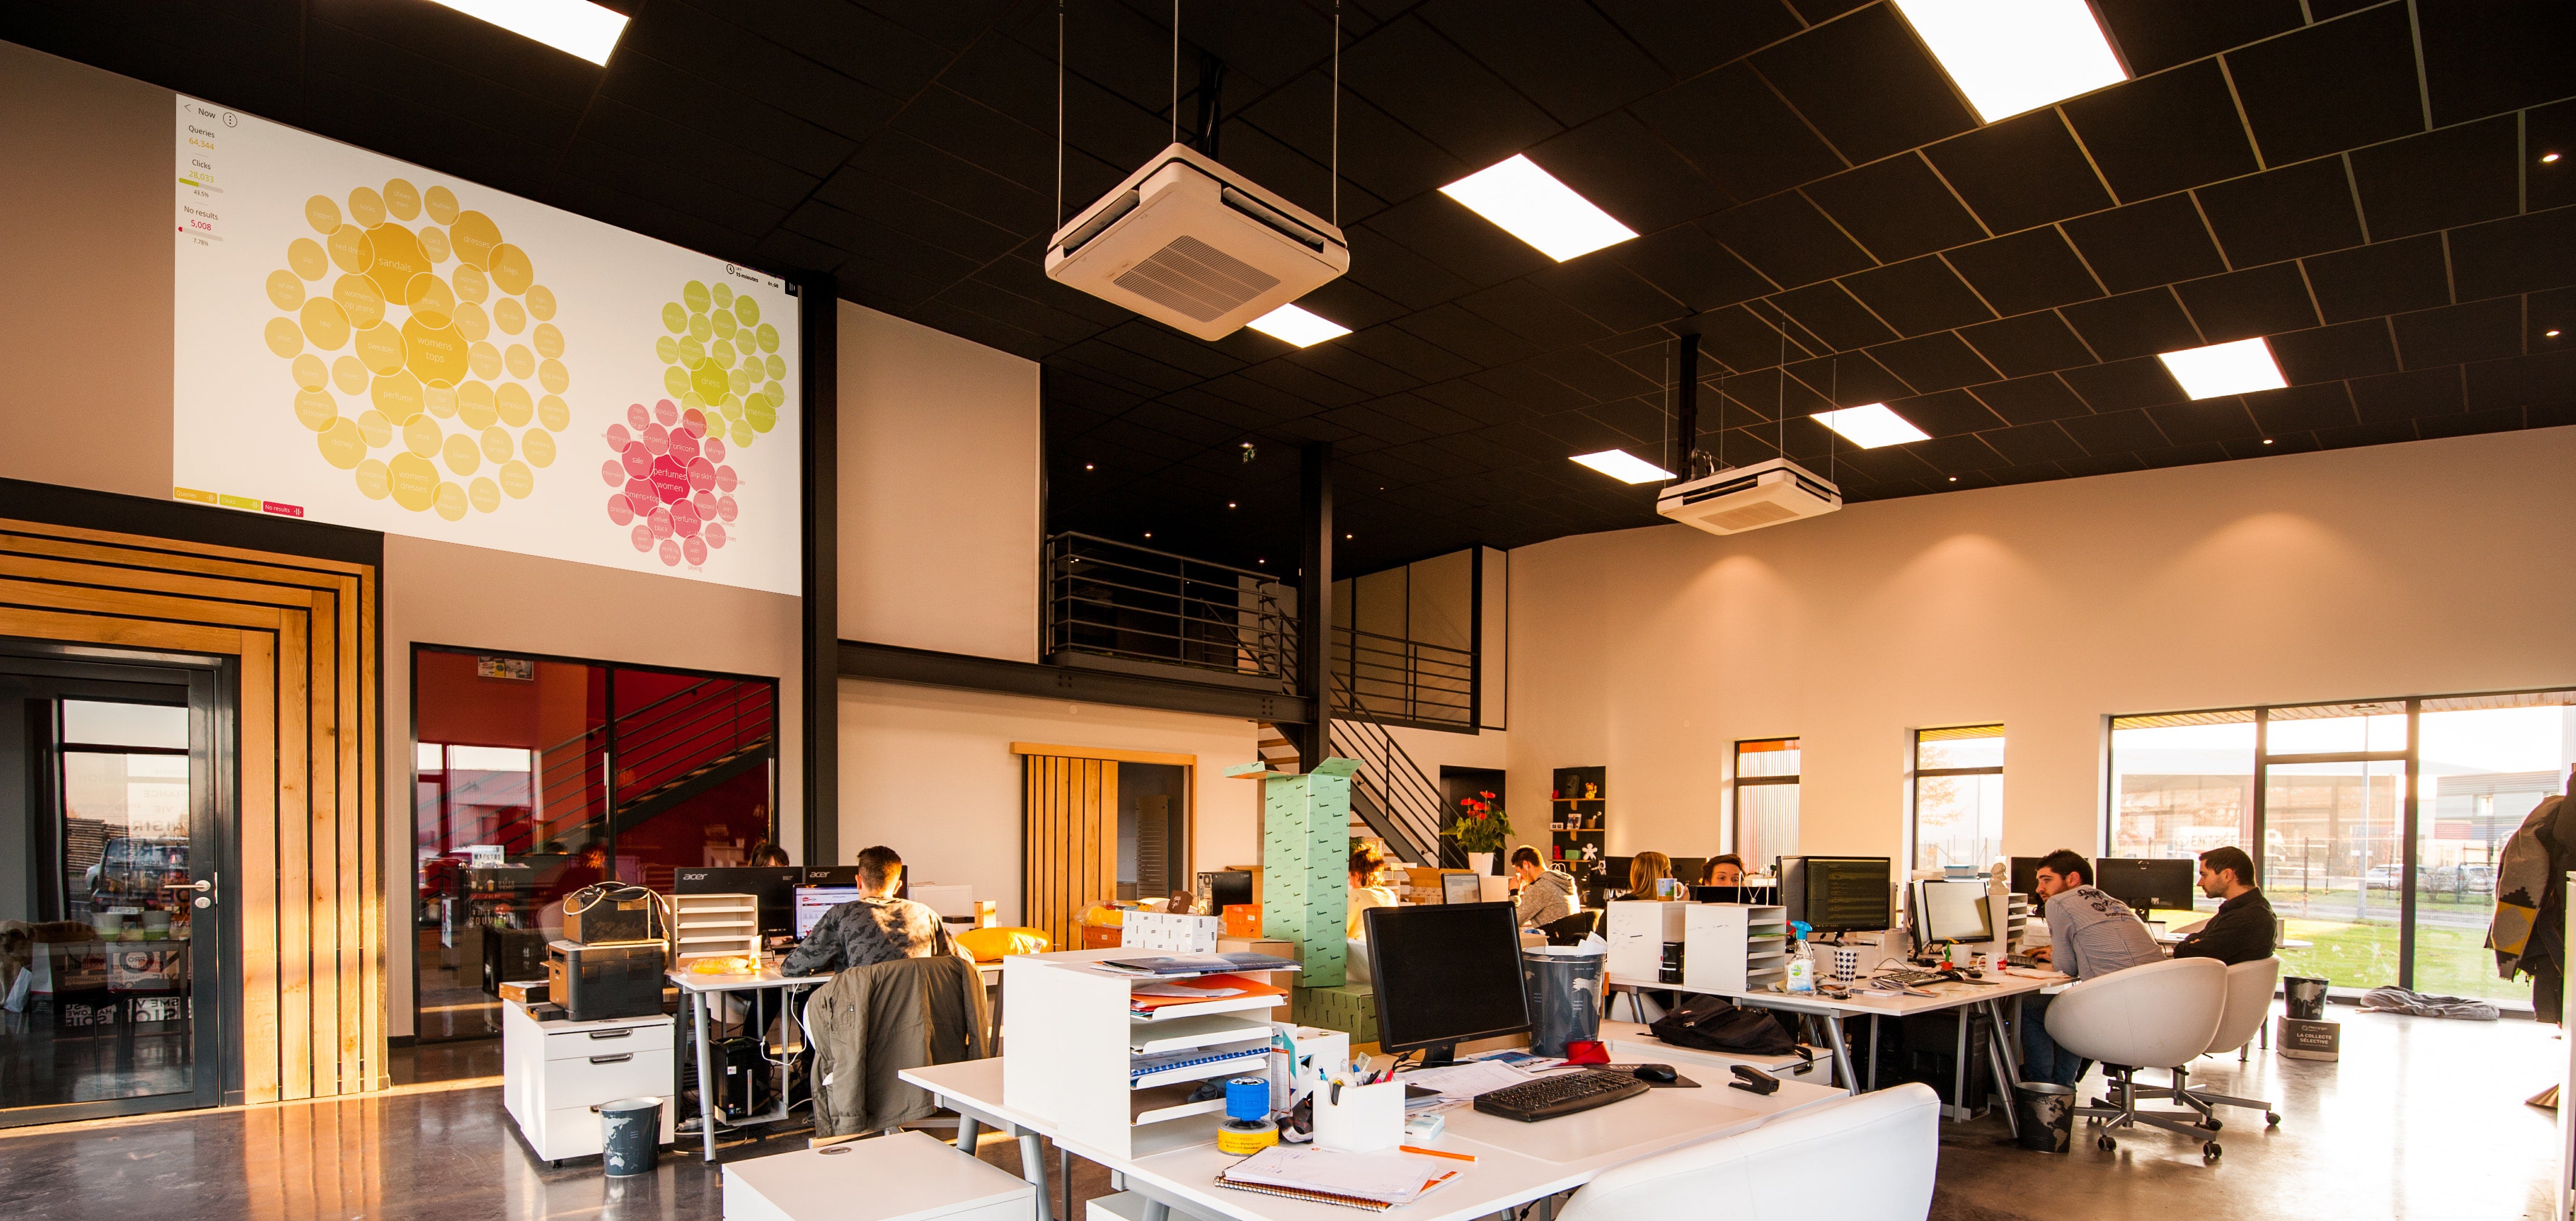
In fact, we’ve seen many clients put up large plasma screens in their offices dedicated to showing this visualisation. Displaying their real-time queries and search performance while identifying patterns and relationships between the three main search KPI’s: Queries, Clicks and No Results.

This visualisation not only enables retailers to see the online store’s real-time queries to identify the most popular and clicked on searches and spot trends across different languages, countries and devices, but it’s also key to identifying issues. It offers a lightning fast picture to flag any potential problems to ensure immediate action can be taken, such as a surge in demand for an item or products going out of stock and triggering No Results pages.
That’s why many Empathy clients love the power of being able to easily visualise the behaviour and queries taking place in their store as they happen. What’s more, as the Now visualisation enables retailers to proactively identify and action opportunities and trends, while also reacting early to any issues or new customer behaviours, it’s also a real gamechanger.

If you want to learn more about the Now visualisation, the actionable insights it offers and the way it provides instant interaction with customers, download the Now overview.
